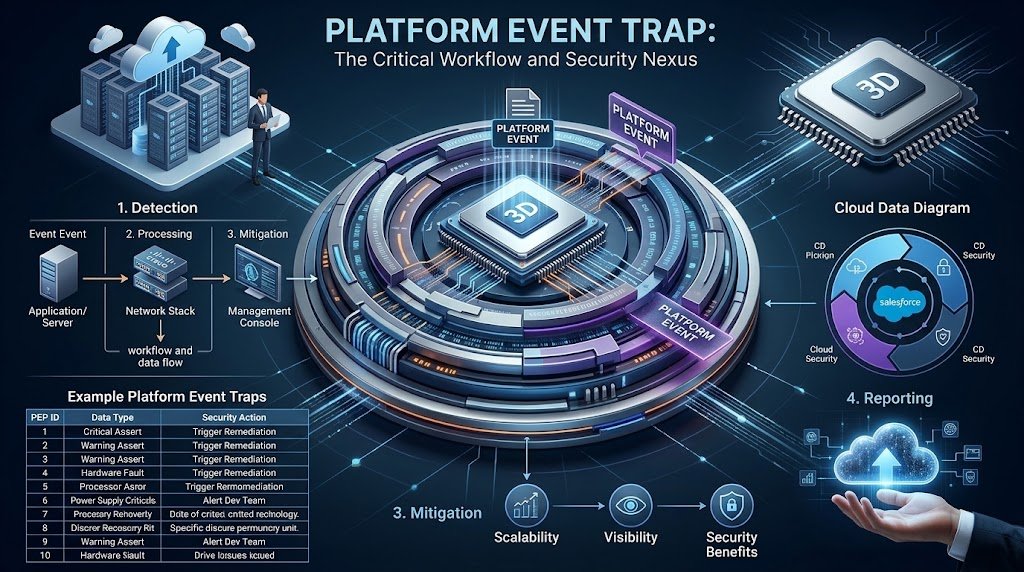
A platform event trap is an important hardware-alerting mechanism that helps IT teams identify physical problems before they lead to extended network outages. When a supported management controller detects a hardware or firmware event, it can send a notification to a configured monitoring system using the Intelligent Platform Management Interface (IPMI) and Simple Network Management Protocol (SNMP).
For network administrators, monitoring these events is part of maintaining reliable infrastructure. Power supply problems, abnormal temperatures, fan failures, and other hardware conditions can affect network availability. However, the exact alerts and management options depend on the Cisco device model and its hardware architecture.
This guide explains what a Platform Event Trap (PET) means, how it differs from standard SNMP notifications, how to monitor relevant hardware alerts on Cisco switches, and which troubleshooting practices help administrators respond effectively.
What Is a Platform Event Trap (PET)?

A Platform Event Trap (PET) is an SNMP notification associated with a hardware or firmware event and defined within the IPMI alerting framework. On supported systems, a Baseboard Management Controller (BMC) or service processor can generate the notification independently of the main operating system. This allows certain alerts to remain available even when the primary operating system becomes unresponsive.
The purpose of a PET is to communicate a significant hardware condition to an administrator or monitoring platform. Instead of relying exclusively on an operating system log, the management controller can send an out-of-band notification to a configured destination.
It is important to understand that not every Cisco switch supports IPMI-based PET functionality. Some Cisco switches report environmental and hardware conditions through Cisco IOS or IOS XE, while supported UCS systems provide dedicated platform event filter and alert settings through the Cisco Integrated Management Controller (CIMC). Administrators should verify the documentation for their specific hardware before applying PET configuration instructions.
| 🔗 You may also like: |
| Safetrode Com |
| Statens Luftfartsvaesen |
Why Platform Event Trap Monitoring Matters
Network switches connect users, applications, servers, and other infrastructure. A hardware problem affecting a core or distribution switch can interrupt communication across multiple systems, making early detection important for network operations.
Monitoring hardware events helps IT teams investigate issues that ordinary connectivity checks may not explain. A switch might still respond to some management requests while experiencing a failing power supply, abnormal temperature, or another hardware warning. In more severe cases, the device may restart or become unreachable.
A properly configured monitoring system helps administrators correlate alerts with device status, environmental readings, and maintenance records. This shortens the investigation process and makes it easier to determine whether a problem requires a configuration change, physical inspection, component replacement, or vendor support.
Common Causes of Platform Event Trap Alerts
A hardware-related trap does not automatically identify the root cause. Administrators should use the event description, sensor readings, device logs, and hardware documentation to determine what happened.
1. High Temperature and Cooling Problems
Temperature alerts may occur when a switch approaches or exceeds its supported operating thresholds. Blocked ventilation, failed fans, excessive ambient temperatures, or restricted airflow can contribute to overheating.
When a temperature-related alert arrives, check the switch’s environmental status, inspect the surrounding rack, and verify that air intake and exhaust paths are unobstructed. Compare sensor readings with the thresholds specified for the particular model.
2. Power Supply Failures
A power-related alert may indicate a failed power supply, loss of an input power source, or a problem with redundant power. The impact depends on the switch’s power configuration and whether another supply can support the device.
Check the status indicators, power connections, available redundancy, and relevant environmental output. If the switch uses two power supplies, do not assume that the second supply is functioning correctly simply because the device remains online.
3. Fan and Hardware Sensor Issues
Fan failures can reduce cooling capacity, while sensor problems may make environmental monitoring unreliable. An alert could indicate an actual hardware fault, a transient condition, or a sensor that requires further investigation.
Compare the alert with current readings and any recent maintenance activity. If the same sensor repeatedly reports abnormal values, collect logs and diagnostic information before deciding whether the component needs replacement.
4. Unexpected Restarts or Hardware Instability
A switch that repeatedly restarts, freezes, or becomes unreachable may have a hardware problem, a software defect, or a power-related issue. A PET can help identify a related hardware event on supported systems, but it does not prove that hardware caused every restart.
Correlate the alert timestamp with system logs, uptime changes, crash information, and power events. This approach helps distinguish a physical fault from a software or configuration problem.
Best Practices for Monitoring Cisco Switches
Effective monitoring requires more than enabling a few SNMP notifications. Administrators should combine environmental checks, centralized alerting, secure management access, and a documented response process.
1. Configure SNMP Notifications Correctly
On Cisco IOS platforms that support environmental monitoring traps, administrators can configure an SNMP destination and enable relevant notification categories. Cisco documents snmp-server host for specifying notification recipients and snmp-server enable traps for enabling supported trap types.
For example, on a compatible IOS device, a basic configuration pattern may look like this:
configure terminal
snmp-server host 192.0.2.50 version 3 priv monitoruser
snmp-server enable traps envmon
end
This is an illustrative example, not a universal Cisco configuration. The SNMPv3 user and security settings must be configured appropriately, and the syntax must be verified against the device’s software release. The envmon notification category applies only where supported; it does not automatically enable IPMI-based PET alerts from a separate management controller.
After configuration, confirm that the intended notifications are enabled and that the monitoring server can receive them. Use your organization’s approved test procedure rather than deliberately creating a dangerous hardware condition.
2. Monitor Environmental Status Regularly
Cisco provides environmental commands on supported switch platforms to inspect temperature, fan, and power status. Depending on the model and software, commands include show environment all or show env all.
Useful checks include:
show environment all
show logging
show version
Command availability and output vary by platform. Some models use different command forms, and a command that works on one Catalyst family may not work on another.
Schedule routine checks for critical switches and investigate warning states promptly. Comparing current readings with previous results can help identify a deteriorating component before it causes a more serious outage.
3. Use Centralized Network Monitoring
A centralized network management system (NMS) gives administrators a common view of hardware notifications across their infrastructure. It can associate incoming traps with device inventories, alert priorities, incident tickets, and escalation procedures.
Configure each supported device to send the relevant notifications to the correct monitoring destination. Verify that firewalls and access-control rules allow the required management traffic, including SNMP traps over UDP port 162 where applicable.
The NMS should distinguish between an initial fault, repeated notifications for the same incident, and a recovery event. This makes it easier to recognize persistent hardware problems without overwhelming engineers with duplicate tickets.
4. Secure SNMP and Management Interfaces
SNMPv3 supports authentication and privacy features that can help protect management traffic. Where supported, use an appropriate SNMPv3 security configuration, restrict access to authorized management systems, and avoid exposing management services to untrusted networks.
Review access to the BMC or CIMC interface separately when the device provides one. Use unique credentials, role-based access where available, and secure management paths. SNMP security on the switch does not automatically secure a separate management controller.
5. Maintain Accurate MIBs and Alert Definitions
Management Information Bases (MIBs) help monitoring software interpret SNMP object identifiers and associated values. If the required vendor MIBs are missing or outdated, an NMS may display incomplete or unfamiliar information.
Maintain the appropriate Cisco MIB files for the relevant device and software release. Validate that incoming notifications are mapped to meaningful descriptions, device names, severity levels, and troubleshooting instructions.
Do not assume that every hardware alert uses the same identifier across all Cisco product families. Interpret the actual notification payload using the relevant product documentation.
6. Establish Clear Alert Priorities
Not every hardware notification requires the same response. A critical temperature condition or loss of redundant power may require immediate investigation, while a recovery notification may simply confirm that a previous issue has cleared.
Build alert rules around the device’s role, redundancy, reported severity, and business impact. A fault on a core switch serving several buildings may deserve a different escalation path from a warning on a redundant access switch.
Document who receives each alert, how quickly it must be acknowledged, and when the incident should be escalated to the network engineering team or Cisco support.
7. Review Alerts After Maintenance
Planned maintenance can produce legitimate changes in power, fan, module, or sensor status. Before a maintenance window, document the expected events and ensure that the operations team knows which devices are affected.
Where supported, adjust notification handling in the NMS to reduce unnecessary duplicate incidents without concealing genuine faults. Restore normal alerting after maintenance and verify that the monitoring system is receiving notifications again.
Avoid disabling all hardware alerts simply to reduce noise. If an alert category must be suppressed temporarily, record the change, limit its scope, and confirm that the protection is restored when the work ends.
| 🔗 You may also like: |
| Guru Knowledge Base Software |
| Techtrendery Com USA |
How to Troubleshoot Platform Event Trap Alerts
When an alert arrives, follow a consistent troubleshooting process instead of immediately restarting the switch or replacing hardware.
Step 1: Identify the Alert Source
Determine whether the notification originated from the switch’s operating system, a supported CIMC/BMC management controller, or an external monitoring platform. Record the device name, event identifier, timestamp, severity, and affected component.
This distinction matters because a standard environmental SNMP trap and an IPMI-based PET are not necessarily generated by the same subsystem.
Step 2: Check Current Hardware Conditions
If the switch is reachable, run the environmental commands supported by its model and review the system logs. Look for temperature warnings, fan failures, power supply status changes, and related messages.
For example:
show environment all
show logging
If the device is unresponsive and has a separate management controller, investigate its event log and hardware status through the supported out-of-band management interface.
Step 3: Correlate Logs and Events
Compare the notification timestamp with switch restarts, configuration changes, power interruptions, and maintenance records. A matching hardware warning can help explain an outage, but timing alone does not prove causation.
Save the relevant logs and diagnostic output before clearing records or making changes. This information can be important when the fault is intermittent.
Step 4: Resolve the Underlying Problem
Correct the cause rather than merely suppressing the alert. Depending on the findings, this could involve restoring airflow, checking facility power, replacing a failed component, or investigating a software defect.
For a critical or recurring hardware fault, follow the product’s maintenance procedures and contact Cisco support when necessary. Avoid unnecessary reboots or component removal before collecting useful diagnostic evidence.
Step 5: Verify Recovery
After corrective action, confirm that environmental readings have returned to acceptable levels and that the switch is operating normally. Check whether the monitoring system receives recovery notifications and whether the original alert continues to recur.
Close the incident only after verifying the underlying condition, not simply because the device has become reachable again.
Platform Event Trap vs. Standard SNMP Trap
Although both mechanisms can deliver SNMP notifications, they are not interchangeable.
| Feature | IPMI-Based PET | Standard Cisco SNMP Trap |
| Event source | Supported BMC or service processor | Device operating system or supported subsystem |
| Typical purpose | Hardware or firmware event alerting | Interface, environmental, configuration, and other supported events |
| OS dependency | Can operate independently of the main OS | Depends on the component generating the notification |
| Configuration | Supported management-controller alert settings | Device SNMP configuration and supported notification categories |
| Main troubleshooting path | Management-controller event logs and hardware status | Switch logs, SNMP settings, MIBs, and relevant device diagnostics |
The exact behavior depends on the implementation. Cisco’s documentation describes both operating-system-based environmental notifications and separate platform event filters for supported CIMC systems.
Practical Monitoring Checklist
Use this checklist when reviewing your Cisco switch monitoring setup.
- Identify which devices support IPMI-based PET functionality.
- Configure the appropriate SNMP destinations and notification categories.
- Verify temperature, fan, and power monitoring.
- Secure SNMP access and management-controller interfaces.
- Confirm that alerts reach the NMS and display meaningful descriptions.
- Configure incident priorities and escalation procedures.
- Review repeated alerts and distinguish faults from recovery notifications.
- Document maintenance-related changes and restore normal alerting afterward.
- Test monitoring using approved procedures and verify end-to-end delivery.
| 🔗 You may also like: |
| 9-7-4 Leash CodeHS Answers |
| SFM Compile |
Conclusion
Platform Event Trap monitoring helps network teams investigate hardware-related events and improve visibility into supported infrastructure. The most effective approach combines accurate SNMP configuration, regular environmental checks, secure management access, centralized alerting, and a structured troubleshooting process.
For Cisco administrators, the key is to distinguish IPMI-based PET functionality from standard switch-generated SNMP notifications. Verify the capabilities of the specific model, investigate each alert using the relevant logs, and confirm that corrective action has resolved the underlying problem. These practices help teams respond more confidently to hardware warnings and maintain reliable network operations.
FAQs
What is a Platform Event Trap on a Cisco switch?
A Platform Event Trap is an IPMI-associated SNMP notification used to report supported hardware or firmware events. Whether a Cisco switch generates PETs directly depends on its hardware and management-controller capabilities.
Does a Platform Event Trap mean the switch is failing?
Not necessarily. A PET indicates that a configured event has occurred, but its severity and meaning depend on the event details. Review the reported sensor, hardware status, and relevant logs before deciding whether immediate intervention is necessary.
Which command checks hardware status on Cisco switches?
On supported models, show environment all or show env all displays environmental information such as temperature, fans, and power supplies. Check the command reference for your specific switch and software version.
Can a Platform Event Trap work if the operating system crashes?
An IPMI-based PET can be generated independently of the main operating system when the device has a supported management controller and the required alerting configuration. This does not mean every Cisco switch can send such notifications during a crash.
What is the difference between PET and PEF?
A Platform Event Trap (PET) is the alert sent to a monitoring destination. A Platform Event Filter (PEF) defines how a supported management controller handles selected platform events, including whether to send an alert or perform a configured action.
How can I reduce unnecessary hardware alerts?
Use appropriate alert thresholds, event filtering where supported, and NMS deduplication. Review recurring notifications to determine whether they represent genuine faults, recovery events, or expected maintenance activity. Avoid suppressing critical alerts without an approved alternative monitoring process.